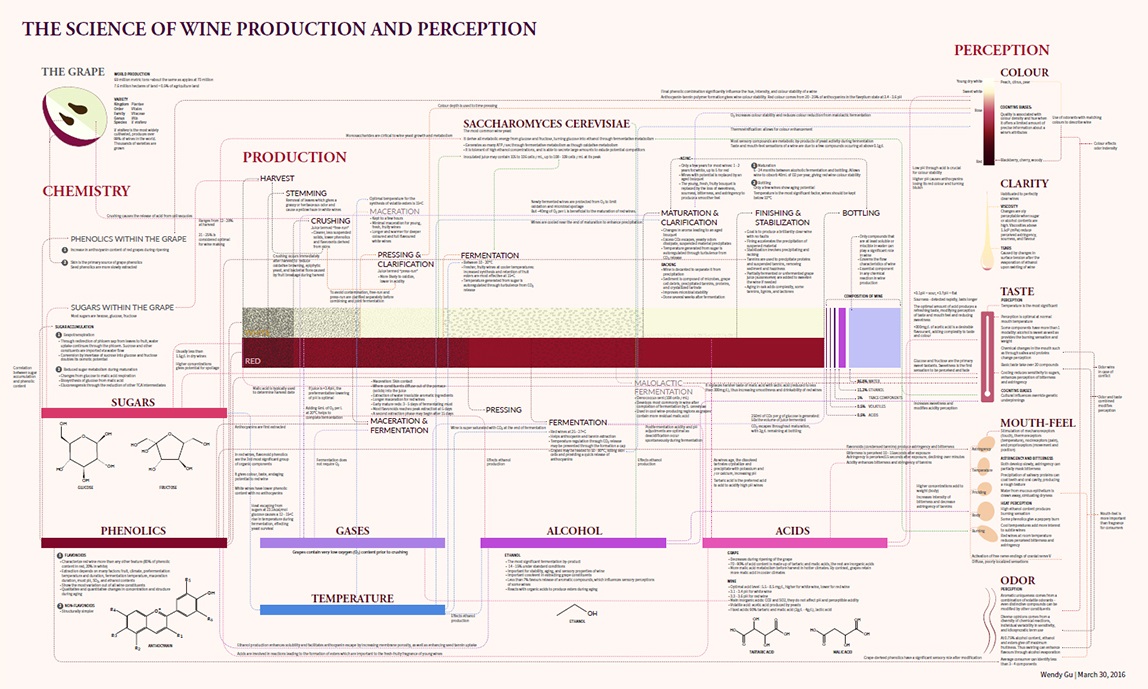
Wine Science
Infograph / data visualization poster
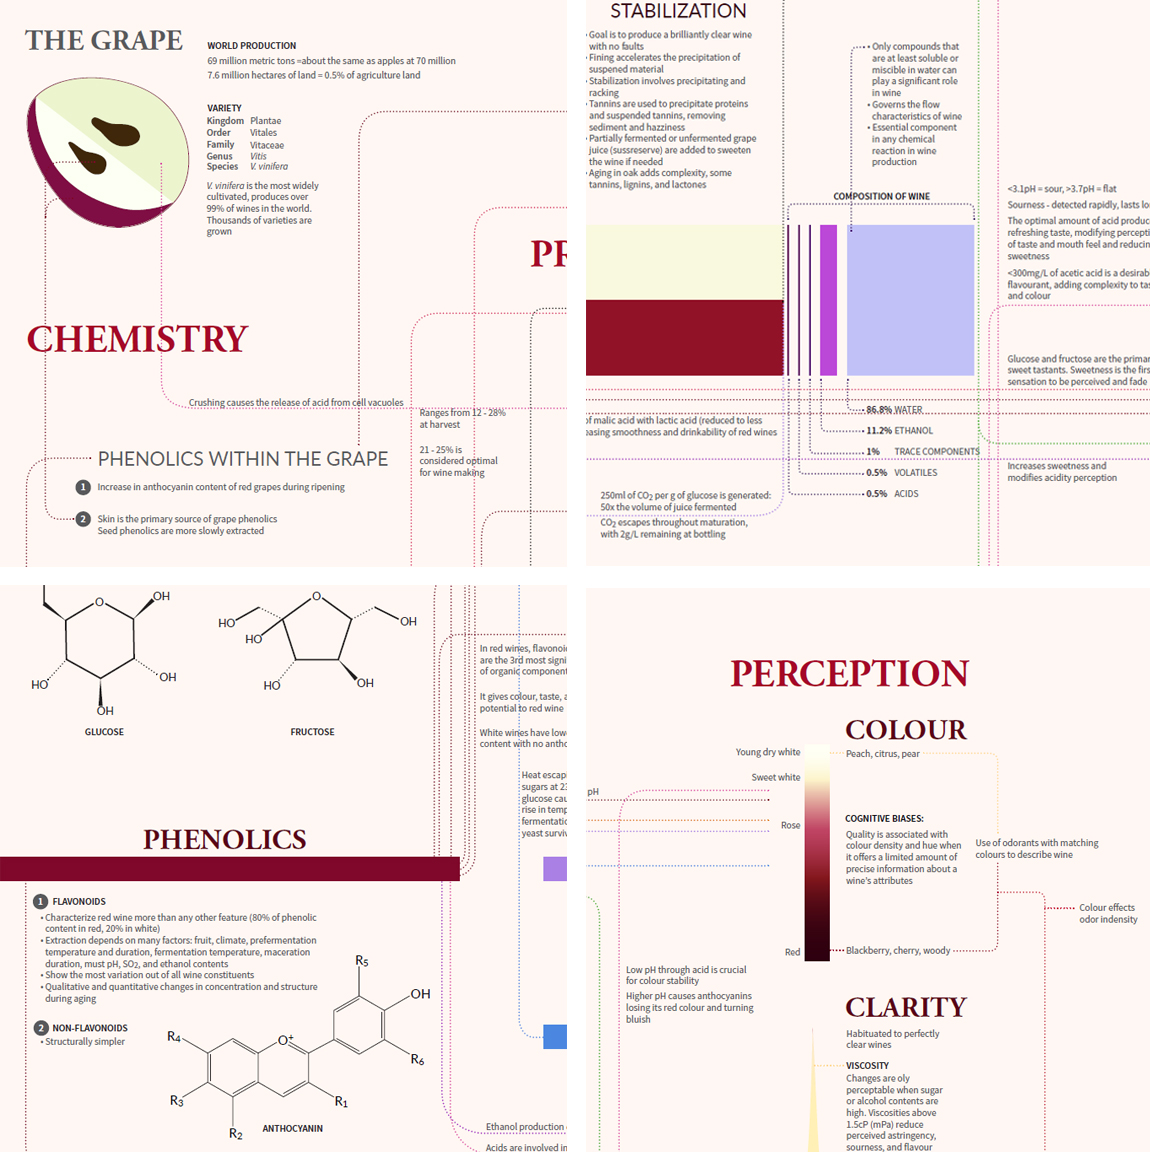
An infograph examining the biochemistry and science behind wine, from its source material to production to consumption.
Using visual hierarchies and layering to condense a huge amount of information on wine science, the project seeks to visualize the controlled chaos that is the science of wine production, to trace and establish connections between its biochemical components from grape to drink, and to convey the intricacies of the whole process.
Close-ups