The Great Backyard Bird Count
Data visualization
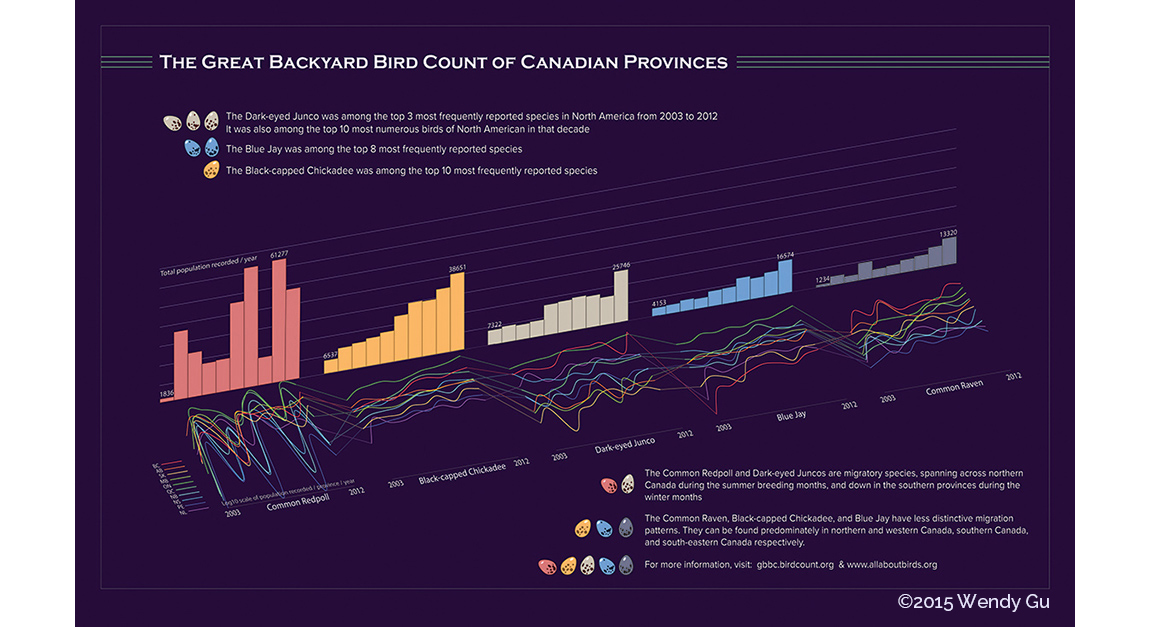
Infograph presenting data from a decade of bird watching in the 10 Canadian provinces. The piece was a challenge in the synthesis and static visualization of large quantities and categories of data.
Data is obtained from The Great Backyard Bird Count by The Cornell Lab of Ornithology.
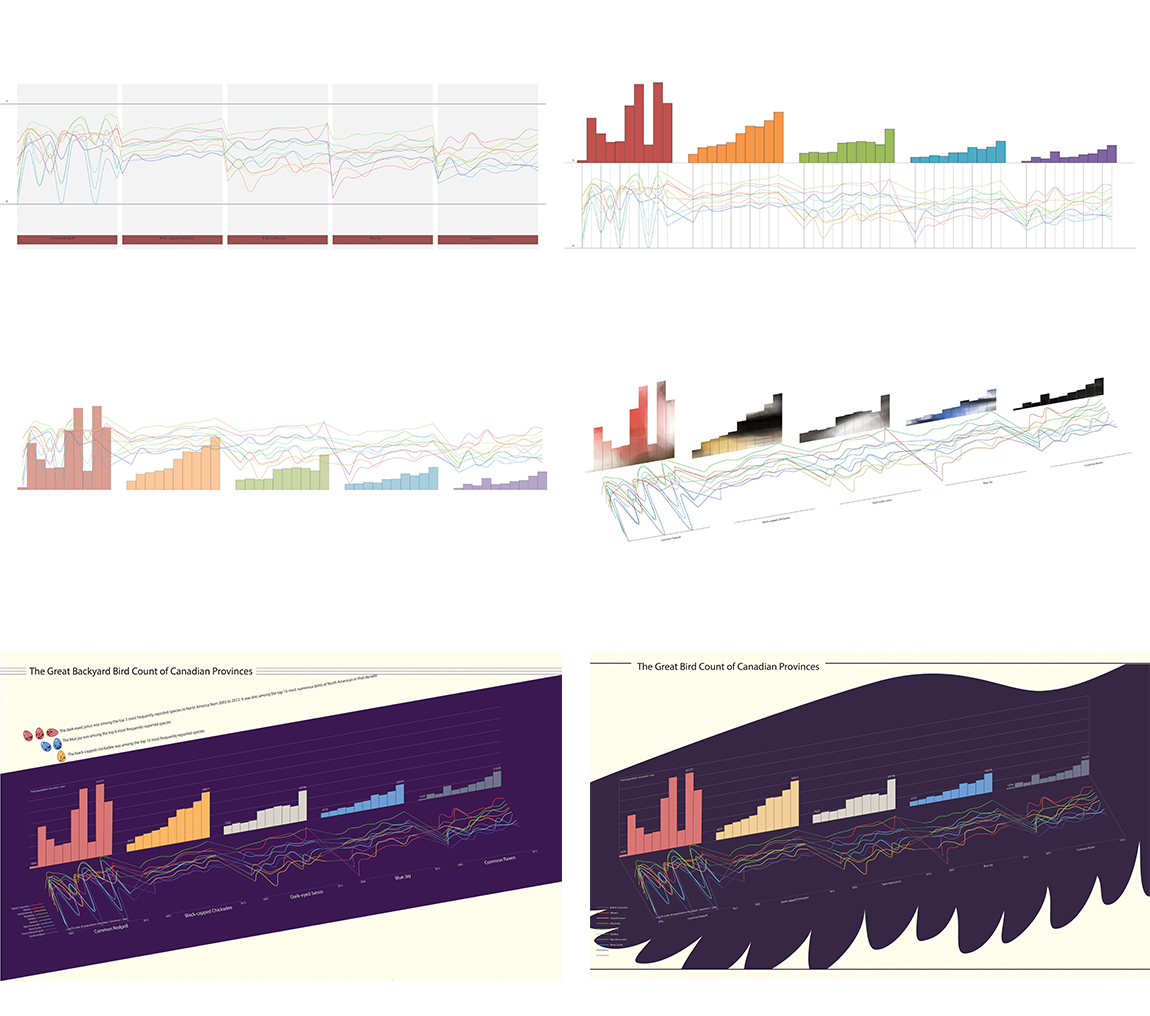
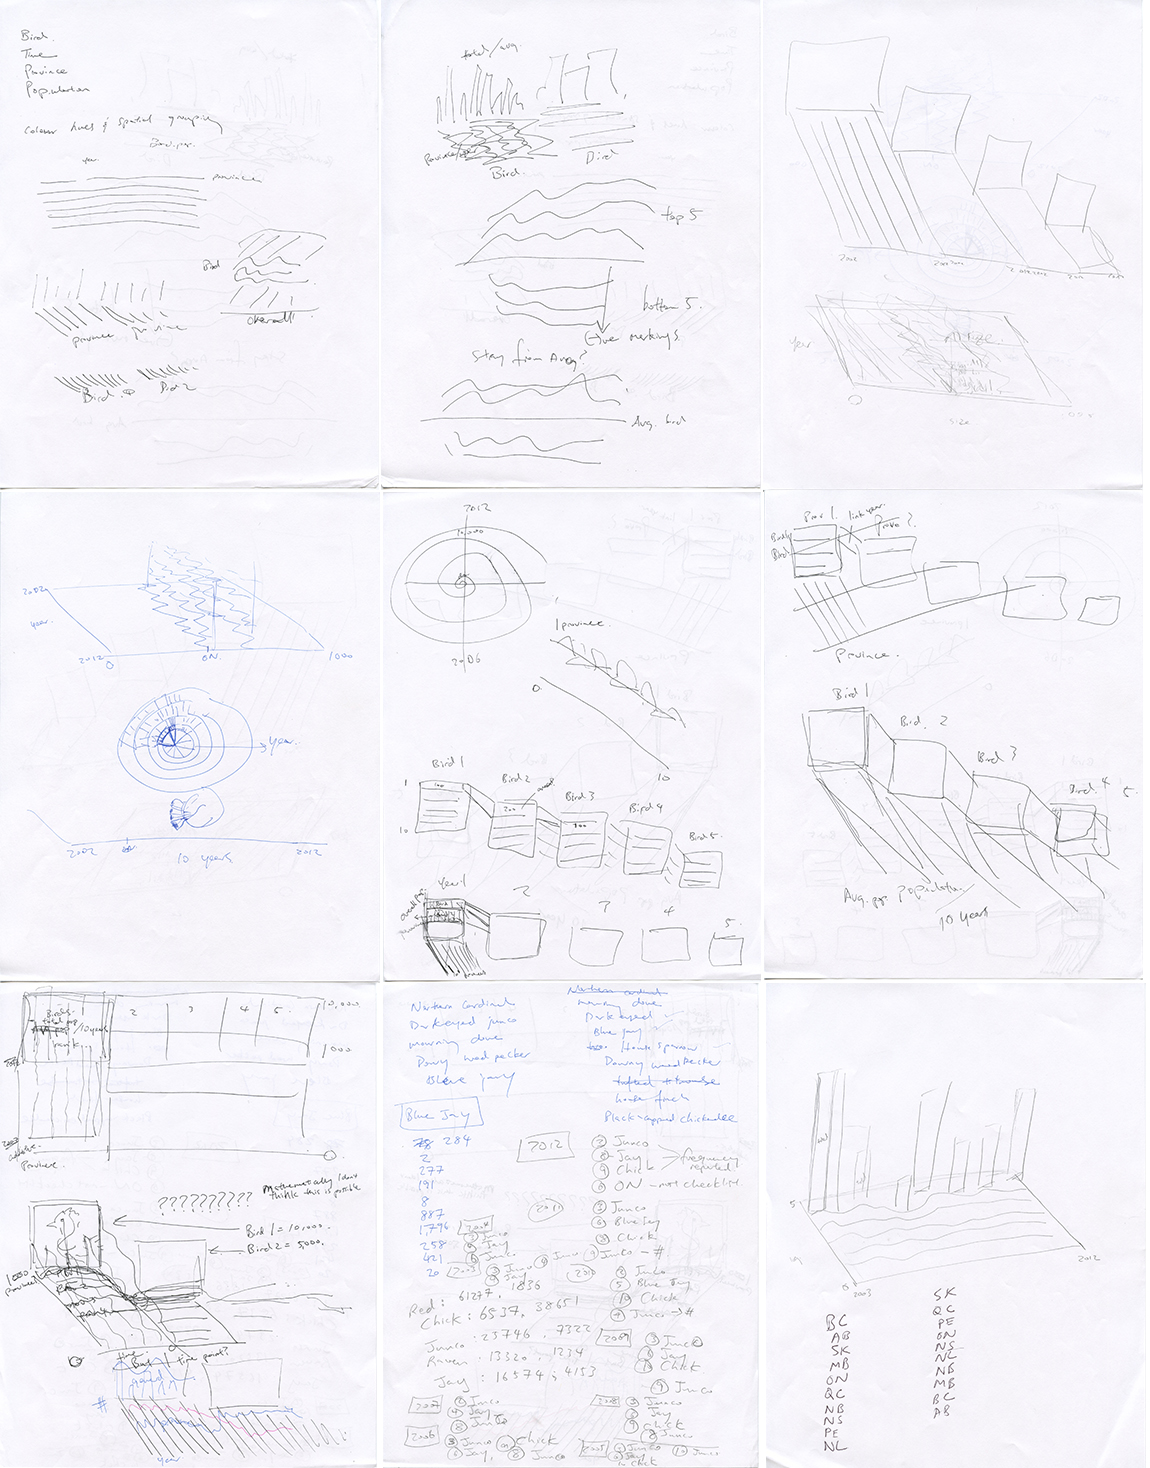
Concept sketches
Sample progress work